Monitoring with Prometheus and Grafana
✦ Quick Answer
Monitoring with Prometheus and Grafana is an engineering deep-dive on DevOps & SRE. Build production observability. Master Prometheus metric types, write PromQL queries, and build Grafana alert dashboards. This guide details the core principles, architecture setups, practical implementations, and technical solutions for optimizing this workload in production environments.
TL;DR Summary
What You'll Build
A technical project demonstrating modern implementation practices for Monitoring with Prometheus and Grafana.
Technologies Used
Key Learning Outcomes
- Understand fundamental design constraints and architectural principles of DevOps & SRE.
- Implement step-by-step hands-on configurations and structured source code patterns.
- Identify common implementation mistakes, deployment challenges, and production resolutions.
Introduction
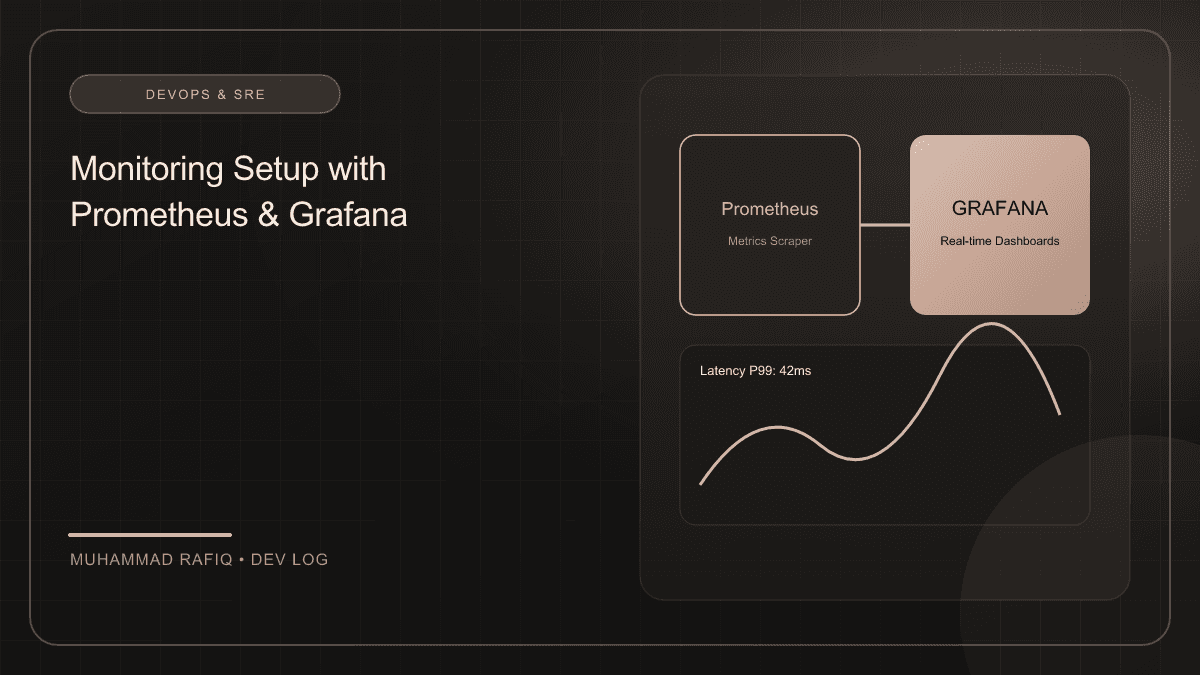
If you aren't monitoring your systems, they are broken and you just don't know it yet. Monitoring gathers real-time telemetry (CPU, memory, request latency, error rates) to detect issues before they impact end users.
Background
The standard stack for monitoring is Prometheus (a time-series database that scrapes metrics via HTTP) and Grafana (a visualization tool that queries Prometheus to build interactive dashboards). Prometheus metrics fall into four categories: Counter, Gauge, Histogram, and Summary.
Implementation
We instrumented our Node.js APIs to expose standard runtime metrics.
Challenges
Building production monitoring platforms presents standard challenges:
- High Cardinality: Injecting user IDs or unique dynamic strings as metric labels, causing Prometheus memory growth.
- Dashboard Clutter: Creating massive dashboards with dozens of charts, making it difficult to identify failures during outages.
Solutions
We solved this by establishing clean standards:
- Label Sanitization: Restricting metric labels strictly to low-cardinality values (like HTTP method, route, and status).
- RED Method Dashboards: Designing main dashboards focused strictly on Rate (requests per second), Errors (failed request rate), and Duration (latency).
Results
Restricting label definitions reduced Prometheus database memory by 70%, and RED dashboards helped operators spot and isolate API failures within 30 seconds of deployment.
Conclusion
Observability is key to site reliability. By instrumenting code with Prometheus clients, collecting RED metrics, and designing structured Grafana dashboards, teams build systems that remain observable and resilient.
Frequently Asked Questions
What is the primary topic of Monitoring with Prometheus and Grafana?
This publication focuses on DevOps & SRE, specifically detailing Build production observability. Master Prometheus metric types, write PromQL queries, and build Grafana alert dashboards with production-grade setups.
What technologies are discussed in this article?
The implementation leverages Monitoring, Prometheus, Grafana, DevOps, illustrating best practices for configuration, containerization, and layout routing.
What are the typical deployment challenges encountered in this space?
Developers frequently face difficulties around state management, configuration separation, environment variables scaling, and runtime performance constraints.
How does the suggested architecture resolve these issues?
The proposed architecture separates data schemas, implements modular service layers, isolates build contexts using multi-stage scripts, and integrates error fallbacks.
Where can I learn more about these concepts?
Refer to the references section at the bottom of the article for official links to framework documentations, design patterns libraries, and code templates.